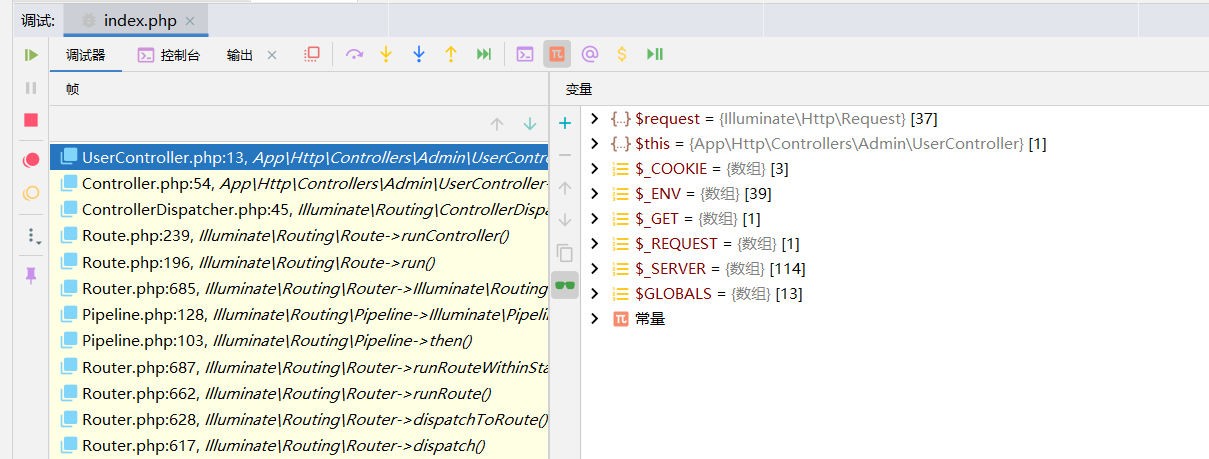
PHPSTROM 配置Xdebug断点调试 # 第一步安装Xdebug 1. 项目根目录下编写index.php输出phpinfo,复制phpinfo到链接地址:https://xdebug.org/wizard 2. 点击Analyse my phpinfo() output按钮,得到以下教程,翻译下大致是 * 下载xdebug.dll * 放到指定目录 * 将下里面的配置放到zend_extension=opcache的后面。 ``` But here are the instructions anyway: Download php_xdebug-3.0.4-7.2-vc15-nts-x86_64.dll Move the downloaded file to D:\soft\phpstudy_pro\Extensions\php\php7.2.9nts\ext Update D:\soft\phpstudy_pro\Extensions\php\php7.2.9nts\php.ini and change the line zend_extension = D:\soft\phpstudy_pro\Extensions\php\php7.2.9nts\ext\php_xdebug-3.0.4-7.2-vc15-nts-x86_64.dll Make sure that zend_extension = D:\soft\phpstudy_pro\Extensions\php\php7.2.9nts\ext\php_xdebug-3.0.4-7.2-vc15-nts-x86_64.dll is below the line for OPcache. Restart the webserver ``` 3. 安装好后重启服务即可 # 配置PHP.INI 找到对应的php配置文件,将下面的配置放到最后,然后重启服务 ``` [Xdebug] xdebug.remote_enable=1 xdebug.remote_host=localhost xdebug.remote_port=9003 xdebug.remote_autostart=1 xdebug.remote_mode="req" xdebug.idekey="PHPSTORM" xdebug.mode = debug ``` # 浏览器安装Xdebug服务。 点击链接 https://www.jetbrains.com/help/phpstorm/2021.1/browser-debugging-extensions.html 安装服务(PS:可能需要科学上网) # 配置PHPSTROM 1. 点击设置 - PHP - CLI解释器 - 新建 2. 选择刚才PHP的可执行文件,输入名称,点击确认 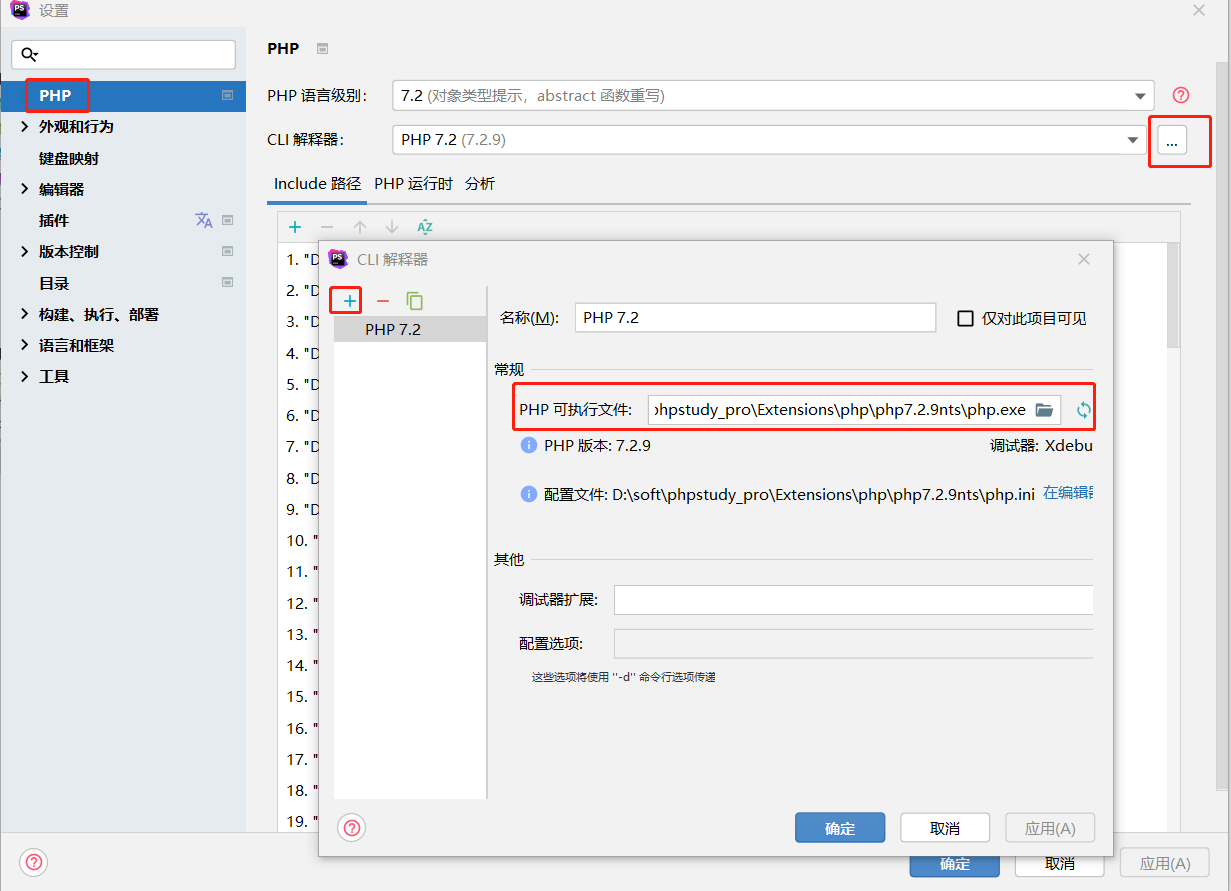 3. 添加服务器 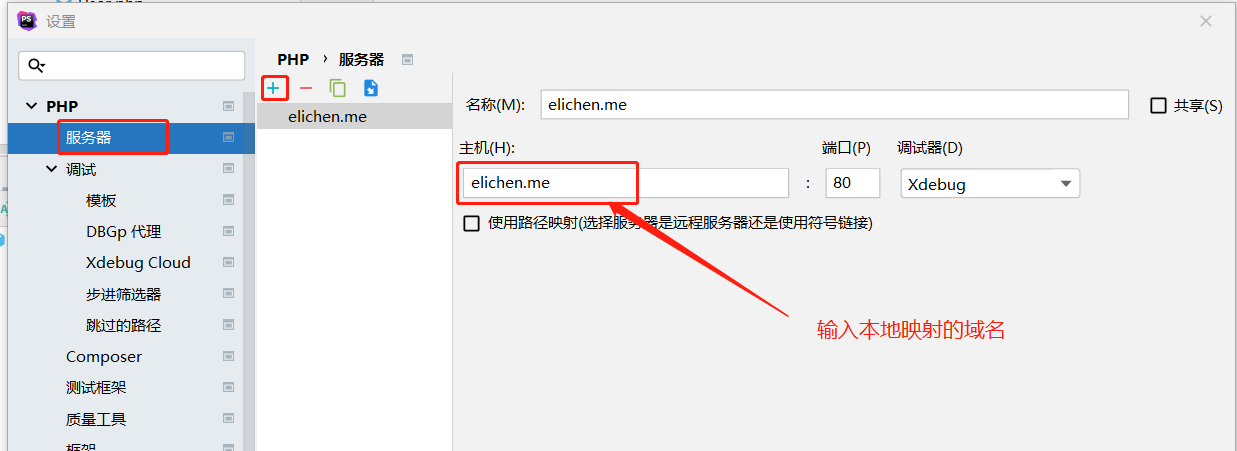 4. 输入刚才PHP.INN的idekey,注意!此处必须与php.ini保持一致 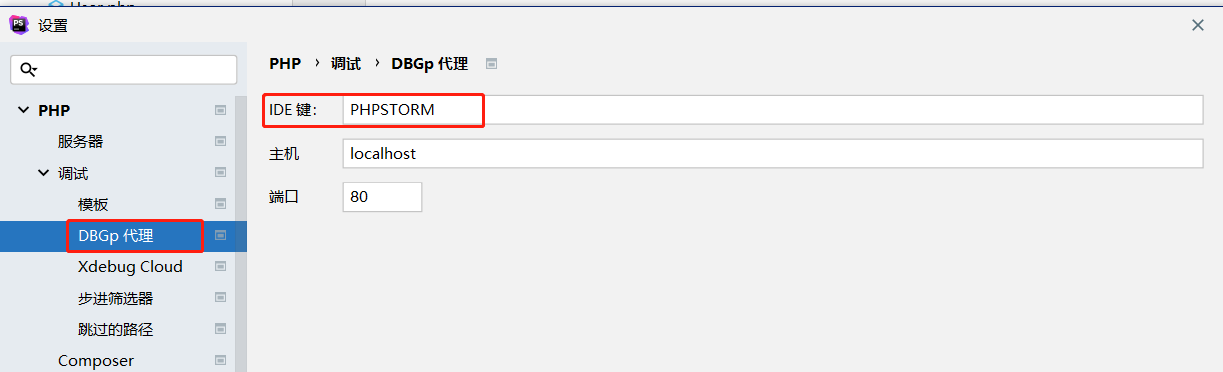 # 尽情享受。 在浏览器上将插件设置为小绿点。 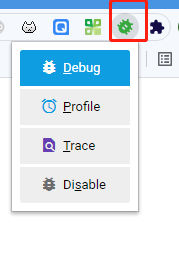 在代码中设置断点。 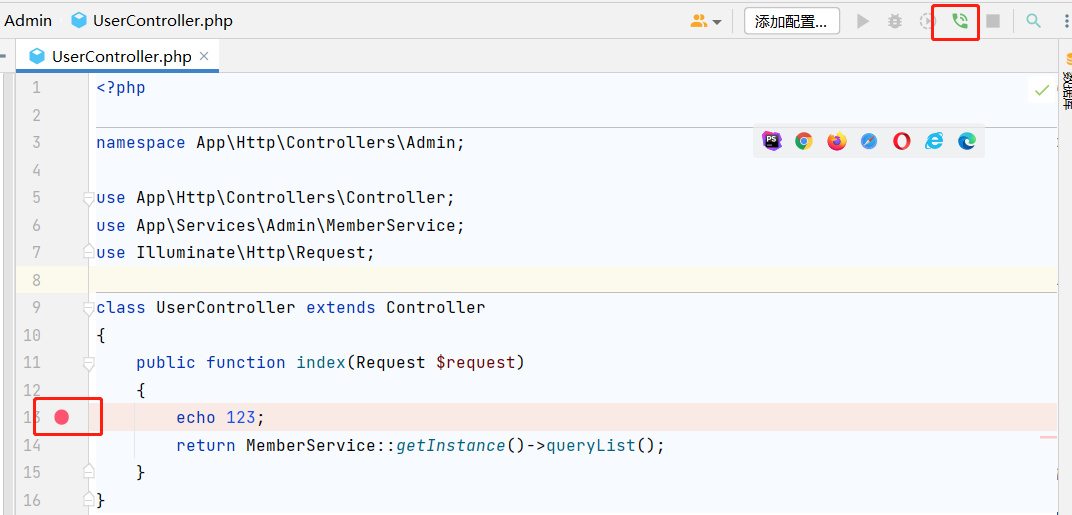 在浏览器请求接口,即可实现断点调试。